Curvenote for Reproducible Research
April 9, 2022
Part of a series on Research Workflows using Curvenote, interviewing Dr. Lindsey Heagy. Start at Part 1.
Reproducibility is something we hear about a lot in science and academia. This is what allows others to verify your claims and ultimately build on your work - which is the basis of science. It may sound simple, but there’s a lot to explore in this concept.
“There are a few ideas to unpack here: for one, there’s computational reproducibility,” said Lindsey. “Meaning that if you have the right software environment and data, you should be able to reproduce the work that I’ve done.”
“But there’s another more important term, which is replicability. This is the ability for a researcher to follow the description of what you’ve proposed, but use their own implementation and ideas to get comparable results. That way you can pick up someone’s work, run with it, and build on the ideas.”
Both of these pieces are needed to push scientific discovery forwards. Researchers and scientists will share their code and notebook repositories to satisfy the reproducibility piece, and produce manuscripts that describe their methods to support the replicability side of things.
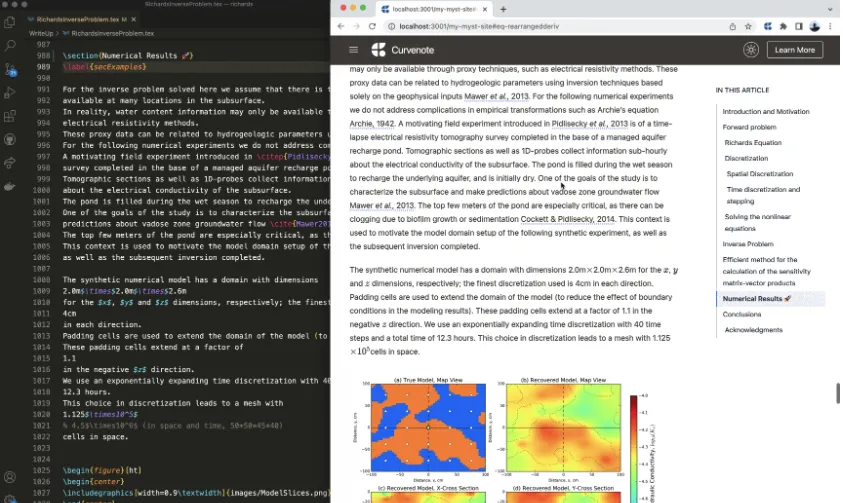
“These areas have been systematically disjointed, though we are moving towards distributing both now,” said Lindsey. “Curvenote strengthens that link, because the figure that we produce in our Jupyter Notebooks is the same thing that’s linked in the article we’re writing.”

Figure 1:Connect Jupyter Notebooks and Curvenote articles, and updated figures and comments flow back and forth.
Related to these concepts are the ideas of collaboration and accessibility; how you can make it easy for others to view, edit, and use your data and research - whether that’s across disciplines, industries or just within your own department. However, challenges can arise depending on the tools used.
“Typically in geophysics, we’re writing scientific papers in LaTeX because so many equations are involved,” said Lindsey. “It’s basically the same thing as writing Python scripts, which not everyone is comfortable with. And then usually you’re committing your work to GitHub, so any collaborators have to get set up on that too.”
But if you turn to a lighter-weight option, like Google Docs, to make it easier on your collaborators - you lose the link to reproducible content. Figures are copied and pasted in with no easy links back to the data, there’s no interactivity, and you lose the ability to write out equations.
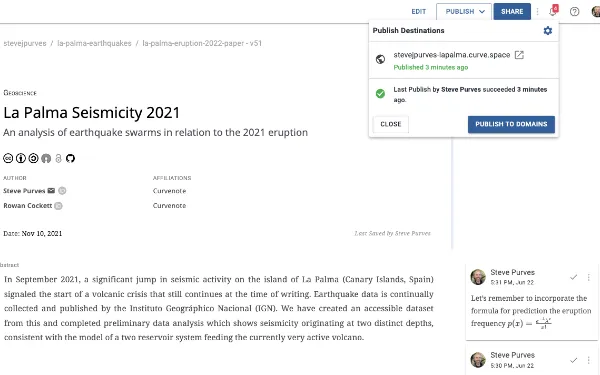
“The Curvenote editor is really powerful because it contains all the technical tools needed to write a paper - but it also removes the barriers for collaborators,” said Lindsey. “You can bring in equations, easily create citations, reference figures, and all that. But you can also create headings that look like headings, and when you write the equation, it renders - so you can see it and make sure it’s correct.”
And of course, there’s also the option to bring in figures and other content from your Jupyter Notebooks with Curvenote’s extension.
“Curvenote fundamentally changes who can participate in scientific discussions. Someone can look at your Jupyter Notebook in Curvenote and comment on it, without actually having to open or install Jupyter,” said Lindsey. “I can just save my Jupyter Notebook to Curvenote, and then I send them a link! So I’m really excited to see what sort of opportunities this opens up within science.”
Learn More About Curvenote Workflows
Explore how researchers and scientists are using Curvenote to enhance their workflows across different aspects of their work - from individual note-taking to collaborative research and educational resource creation.
Using Curvenote’s Jupyter extension and editing tools to keep track of research notes and progress.
Learn how the SimPEG team uses Curvenote for their weekly meetings, embedding interactive figures and references to notebook code and outputs.
Improve reproducible research by linking together your articles and your Jupyter Notebooks. You can make it easy for others to view, edit, and use your data and research.
How to integrate open source and reproducibility practices into presenting educational materials.