Communicating Science
One of the biggest challenges I see in communicating science is that how we share ideas is disconnected from how scientists work on them. Most researchers write using Microsoft Word, collaborating by email, and sharing PDFs; even basic version control and real-time collaboration is often not in place (my_paper_final_3_edited.docx).
The headaches multiply when working in distributed teams and on large-scale computational models and data, both of which are integral to modern science. Static figures are copy/pasted between your computational environment and your PowerPoint slides or your paper — severing any links that aid in computational reproducibility: “Which code ran this figure again?” “What were the model parameters?”. Additionally, commenting and review of results in computational notebooks is disconnected from where you write and think about them.
The disconnect between sharing and working prevents efficient feedback loops, delays publication, and stunts the evolution of ideas.
We are starting Curvenote because we believe that the introduction of tools and platforms that provide feedback loops between working, and sharing will accelerate the speed of scientific discovery. We believe that the feedback loops connecting discovery and communication will promote collaborative evolution of ideas and ultimately increase the relevance and pace of scientific breakthroughs.
That is the dream anyways. 🙂
Open Access
Our team takes a lot of inspiration from the open-source development community, where two people who have never met can reuse each other’s ideas (in this case, software packages), and improve, fix, and generalize these ideas. It happens without them meeting, planning, or really coordinating at all — which, frankly, is amazing.
The necessary first step in this scenario is clear and open licensing of content. The analogue in science is the open access movement — it is a hard fought, critically important, ongoing movement, which is starting to make changes in regulation and the actions of scientific researchers in where and how they publish their work. Open licensing is critical — with openly licensed content there can then be conversations about reuse and remixing.
The legal possibility of reuse from open-access licensing will start to challenge social norms and concepts of plagiarism, authorship, and contribution.
If an author shares their work with a CC-BY license, the legal definition says you can reuse it if you attribute the source. Social norms, however, are quite different: “Can I reuse that great introduction paragraph - it is perfect!” “Nope, that’s still plagiarism!” “Wait what?! It is openly licensed!”.
Infrastructure
These are exciting questions and thought experiments that will require more sophisticated ways of tracking attribution, licensing, changes, and suggestions. In the same way that licensing in the programming world opened possibilities for collaborations between unknown contributors, it also required new technologies and infrastructure to really get off the ground.
Scientific exploration and experimentation is different from programming.
Writing is different than programming.
Most scientists are not trained in software development and the tools built for programmers are necessarily complex but difficult to adopt and don’t quite fit. Researchers focus much of their time on writing, teaching, presenting, experimenting, and exploring new ideas. Many of these use-cases are just not supported or are needlessly complicated.
Jupyter Notebooks
One of the tools that falls in the middle between developers and experimentation is Jupyter. Jupyter Notebooks have caused a pivotal change in relatively little time, allowing researchers and data-scientists to visually explore and interrogate data.
Jupyter Notebooks have changed how we do science; the way we are communicating science is not keeping up.
We believe it is not yet easy or fast enough to share and communicate scientific results to a broad audience.
Where we write, summarize, share, and think together about results is different from where the results are produced.
Researchers copy their results into slide decks to get feedback, they print to PDF, take screenshots, use whiteboards. But. These tools are not linked, an insight from a colleague in your email gets lost; your team doesn’t have access to the latest chart; heck — you don’t even know how to reproduce it sometimes!
Dreams
In the future, every scientific report will feature interactive graphs with live data and computation that will make it significantly easier to share, attribute and reproduce the work.
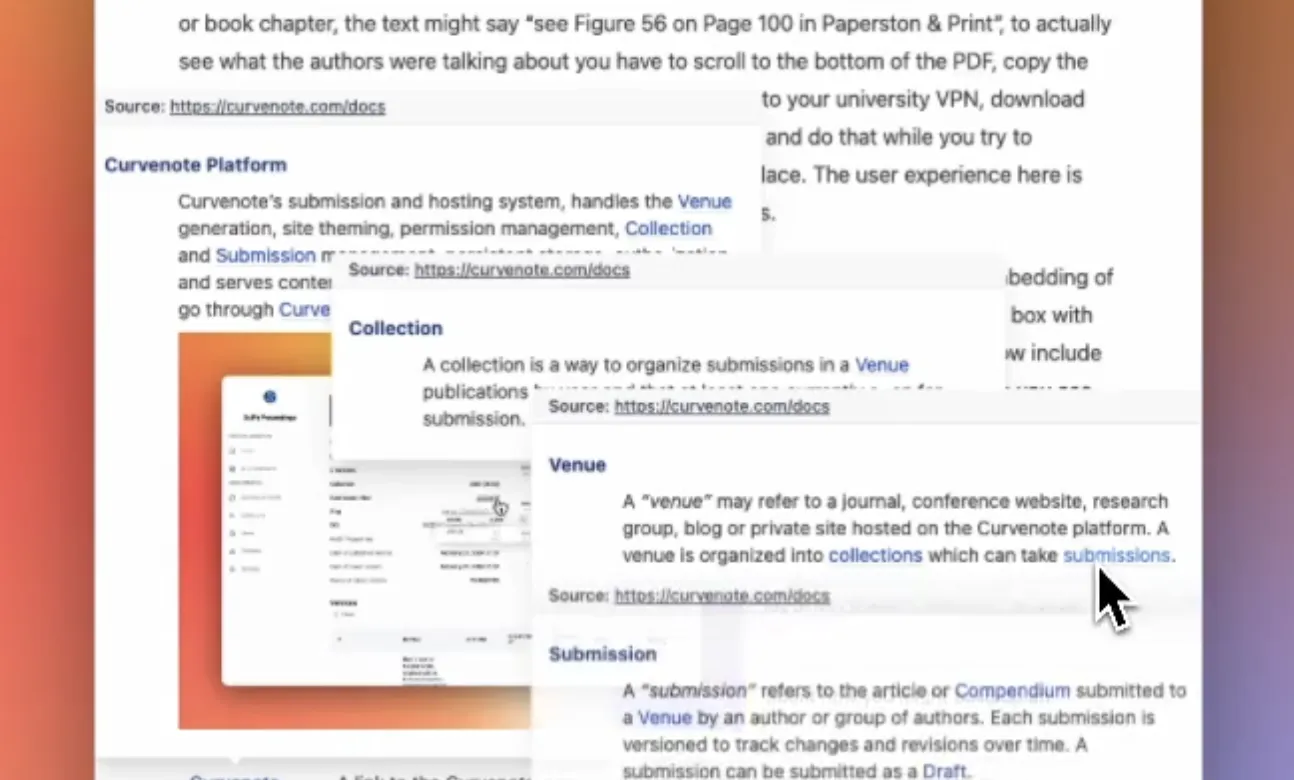
We believe that the tools for sharing, thinking, and writing should be linked to the actual data — the actual science. We believe in continual review and integrated feedback. We believe in evolving ideas and communicating them in living documents.
How does open-science allow us to reimagine how we stand on the shoulders of giants?
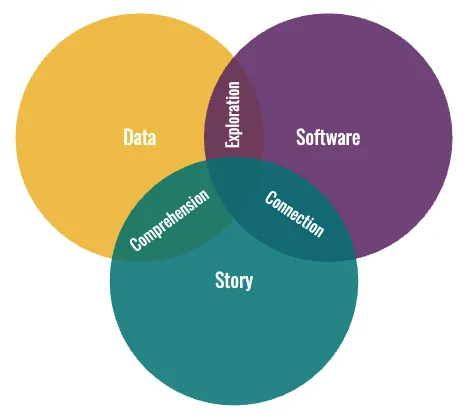
Our goal with Curvenote is to explore the intersection between scientific collaboration, publishing, and technology.
We are building a text editor for modern science.
If you believe, like we do, that the way we communicate science should be more inspired. Accessible, dynamic, open, reproducible, connected. We want to hear from you!
Send us an email, join the Slack Community, or try what we have built so far. We are just getting started.
The main point of this is to say: “Hello world 👋!”
